Countries listed by GDP growth rate in 2011
By Wikipedia,
the free encyclopedia
http://en.wikipedia.org/
This list shows the increase in value of all final goods and services
produced within a nation in a given year, taking into account inflation.

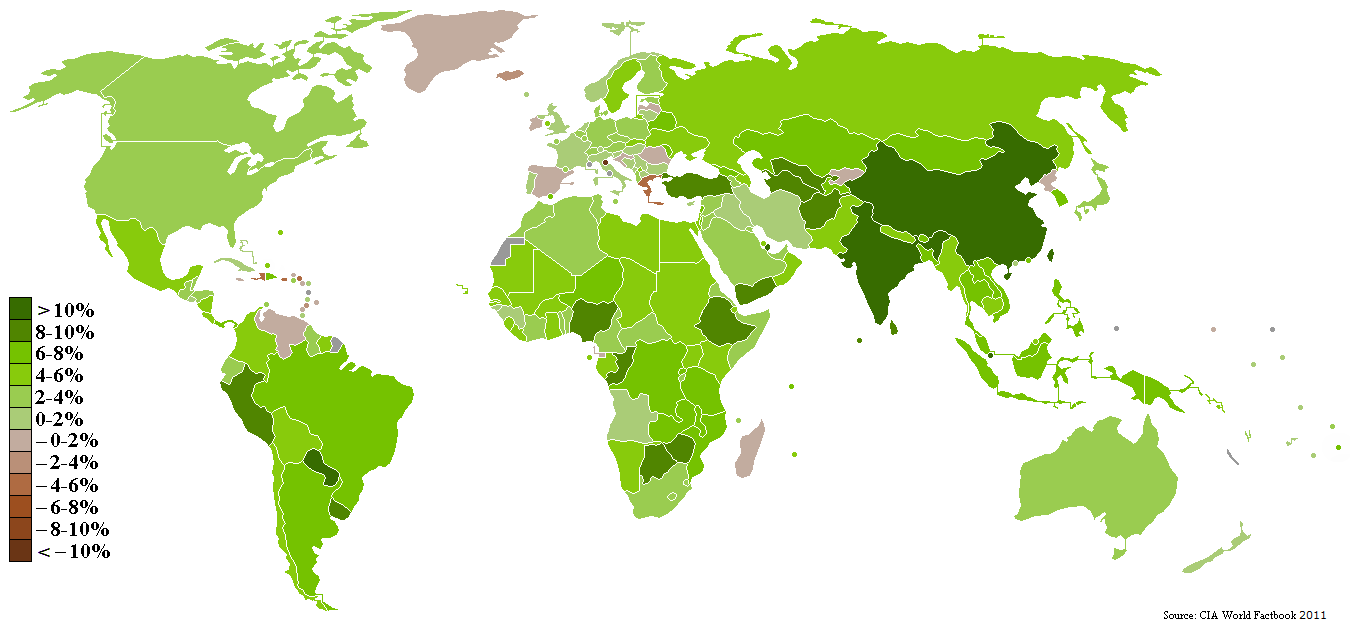
World map showing the CIA estimate of
GDP growth rates for 2010
(click to enlarge)
2011 list
The figures are estimates from the CIA World Factbook.
(only countries whose 2011 results were determined as of February
2012)
| Rank |
Country |
Rate |
| 1 |
 Qatar Qatar |
18.7 |
| 2 |
 Ghana Ghana |
13.5 |
| 3 |
 Mongolia Mongolia |
11.5 |
| 4 |
 Turkmenistan Turkmenistan |
9.9 |
| 5 |
 Iraq Iraq |
9.6 |
| 6 |
 China China |
9.5 |
| 7 |
 Papua
New Guinea Papua
New Guinea |
9 |
| 8 |
 Argentina Argentina |
8.8 |
| 9 |
 Turkey Turkey |
8.5 |
| 10 |
 Sri
Lanka Sri
Lanka |
8.3 |
| 11 |
 Laos Laos |
8.3 |
| 11 |
 Eritrea Eritrea |
8.2 |
| 12 |
 Bhutan Bhutan |
8.1 |
| 13 |
 India India |
7.8 |
| 14 |
 Ethiopia Ethiopia |
7.5 |
| 15 |
 Panama Panama |
7.4 |
| 16 |
 Timor-Leste Timor-Leste |
7.3 |
| 17 |
 Mozambique Mozambique |
7.2 |
| 18 |
 Afghanistan Afghanistan |
7.1 |
| 19 |
 Equatorial
Guinea Equatorial
Guinea |
7.1 |
| 20 |
 Uzbekistan Uzbekistan |
7.1 |
| 21 |
 Kyrgyzstan Kyrgyzstan |
7 |
| 22 |
 Moldova Moldova |
7 |
| 23 |
 Rwanda Rwanda |
7 |
| 24 |
 Liberia Liberia |
6.9 |
| 25 |
 Nigeria Nigeria |
6.9 |
| 26 |
 Cambodia Cambodia |
6.7 |
| 27 |
 Zambia Zambia |
6.7 |
| 29 |
 Chile Chile |
6.5 |
| 30 |
 Democratic
Republic of the Congo Democratic
Republic of the Congo |
6.5 |
| 31 |
 Estonia Estonia |
6.5 |
| 32 |
 Kazakhstan Kazakhstan |
6.5 |
| 33 |
 Maldives Maldives |
6.5 |
| 34 |
 Saudi
Arabia Saudi
Arabia |
6.5 |
| 35 |
 Indonesia Indonesia |
6.4 |
| 36 |
 Paraguay Paraguay |
6.4 |
| 37 |
 Uganda Uganda |
6.4 |
| 38 |
 Bangladesh Bangladesh |
6.3 |
| 39 |
 Botswana Botswana |
6.2 |
| 40 |
 Peru Peru |
6.2 |
| 41 |
 Haiti Haiti |
6.1 |
| 42 |
 Tanzania Tanzania |
6.1 |
| 43 |
 Hong
Kong, China Hong
Kong, China |
6 |
| 44 |
 Lithuania Lithuania |
6 |
| 45 |
 Tajikistan Tajikistan |
6 |
| 46 |
 Uruguay Uruguay |
6 |
| 47 |
 Zimbabwe Zimbabwe |
6 |
| 48 |
 Ecuador Ecuador |
5.8 |
| 49 |
 Vietnam Vietnam |
5.8 |
| 50 |
 Kuwait Kuwait |
5.7 |
| 51 |
 Solomon
Islands Solomon
Islands |
5.7 |
| 52 |
 Cape
Verde Cape
Verde |
5.6 |
| 53 |
 Gabon Gabon |
5.6 |
| 54 |
 Burma Burma |
5.5 |
| 55 |
 The
Gambia The
Gambia |
5.5 |
| 56 |
 Georgia Georgia |
5.5 |
| 57 |
 Niger Niger |
5.5 |
| 58 |
 Guyana Guyana |
5.3 |
| 59 |
 Kenya Kenya |
5.3 |
| 60 |
 Kosovo Kosovo |
5.3 |
| 61 |
 Mali Mali |
5.3 |
| 62 |
 Singapore Singapore |
5.3 |
| 63 |
 Lesotho Lesotho |
5.2 |
| 64 |
 Malaysia Malaysia |
5.2 |
| 65 |
 Taiwan Taiwan |
5.2 |
| 66 |
 Mauritania Mauritania |
5.1 |
| 67 |
 Sierra
Leone Sierra
Leone |
5.1 |
| 68 |
 Belarus Belarus |
5 |
| 69 |
 Bolivia Bolivia |
5 |
| 70 |
 Republic
of the Congo Republic
of the Congo |
5 |
| 71 |
 Sao
Tome and Principe Sao
Tome and Principe |
5 |
| 72 |
 Seychelles Seychelles |
5 |
| 73 |
 Suriname Suriname |
5 |
| 74 |
 Burkina
Faso Burkina
Faso |
4.9 |
| 75 |
 Colombia Colombia |
4.9 |
| 76 |
 Djibouti Djibouti |
4.8 |
| 77 |
 Guinea-Bissau Guinea-Bissau |
4.8 |
| 78 |
 Israel Israel |
4.8 |
| 79 |
 Philippines Philippines |
4.7 |
| 80 |
 Ukraine Ukraine |
4.7 |
| 81 |
 Armenia Armenia |
4.6 |
| 82 |
 Malawi Malawi |
4.6 |
| 83 |
 Morocco Morocco |
4.6 |
| 84 |
 Dominican
Republic Dominican
Republic |
4.5 |
| 85 |
 Oman Oman |
4.4 |
| 86 |
 Sweden Sweden |
4.4 |
| 87 |
 Russia Russia |
4.3 |
| 88 |
 Burundi Burundi |
4.2 |
| 89 |
 Mauritius Mauritius |
4.2 |
| 90 |
 Central
African Republic Central
African Republic |
4.1 |
| 91 |
 Costa
Rica Costa
Rica |
4 |
| 92 |
 Guinea Guinea |
4 |
| 93 |
 Latvia Latvia |
4 |
| 94 |
 Nicaragua Nicaragua |
4 |
| 95 |
 Senegal Senegal |
4 |
| 96 |
 Mexico Mexico |
3.9 |
| 97 |
 South
Korea South
Korea |
3.9 |
| 98 |
 Benin Benin |
3.8 |
| 99 |
 Cameroon Cameroon |
3.8 |
| 100 |
 Poland Poland |
3.8 |
| 101 |
 Togo Togo |
3.8 |
| 102 |
 Vanuatu Vanuatu |
3.8 |
| 103 |
 Angola Angola |
3.7 |
| — |
World average |
3.7 |
| 104 |
 Luxembourg Luxembourg |
3.6 |
| 105 |
 Namibia Namibia |
3.6 |
| 106 |
 Honduras Honduras |
3.5 |
| 107 |
 Nepal Nepal |
3.5 |
| 108 |
 South
Africa South
Africa |
3.4 |
| 109 |
 Austria Austria |
3.3 |
| 110 |
 Slovakia Slovakia |
3.3 |
| 111 |
 United
Arab Emirates United
Arab Emirates |
3.3 |
| 112 |
 Kiribati Kiribati |
3 |
| 113 |
 Macedonia Macedonia |
3 |
| 114 |
 Algeria Algeria |
2.9 |
| 115 |
 Brazil Brazil |
2.8 |
| 116 |
 Brunei Brunei |
2.8 |
| 117 |
 Guatemala Guatemala |
2.8 |
| 118 |
 Venezuela Venezuela |
2.8 |
| 119 |
 Finland Finland |
2.7 |
| 120 |
 Germany Germany |
2.7 |
| 121 |
 Albania Albania |
2.5 |
| 122 |
 Belize Belize |
2.5 |
| 123 |
 Chad Chad |
2.5 |
| 124 |
 Iran Iran |
2.5 |
| 125 |
 Jordan Jordan |
2.5 |
| 126 |
 Malta Malta |
2.5 |
| 127 |
 Iceland Iceland |
2.4 |
| 128 |
 Pakistan Pakistan |
2.4 |
| 129 |
 Serbia Serbia |
2.3 |
| 130 |
 Bosnia
and Herzegovina Bosnia
and Herzegovina |
2.2 |
| 131 |
 Bulgaria Bulgaria |
2.2 |
| 132 |
 Canada Canada |
2.2 |
| 133 |
 Comoros Comoros |
2.2 |
| 134 |
 Switzerland Switzerland |
2.1 |
| 135 |
 Antigua
and Barbuda Antigua
and Barbuda |
2 |
| 136 |
 The
Bahamas The
Bahamas |
2 |
| 137 |
 Belgium Belgium |
2 |
| 138 |
 El
Salvador El
Salvador |
2 |
| 139 |
 New
Zealand New
Zealand |
2 |
| 140 |
 Saint
Lucia Saint
Lucia |
2 |
| 141 |
 Samoa Samoa |
2 |
| 142 |
 Australia Australia |
1.8 |
| 143 |
 Barbados Barbados |
1.8 |
| 144 |
 Czech
Republic Czech
Republic |
1.8 |
| 145 |
 Hungary Hungary |
1.8 |
| 146 |
 Montenegro Montenegro |
1.8 |
| 147 |
 France France |
1.7 |
| 148 |
 Norway Norway |
1.7 |
| 149 |
 European
Union European
Union |
1.6 |
| 150 |
 Netherlands Netherlands |
1.6 |
| 151 |
 Bahrain Bahrain |
1.5 |
| 152 |
 Denmark Denmark |
1.5 |
| 153 |
 Fiji Fiji |
1.5 |
| 154 |
 Jamaica Jamaica |
1.5 |
| 155 |
 Lebanon Lebanon |
1.5 |
| 156 |
 Romania Romania |
1.5 |
| 157 |
 Saint
Kitts and Nevis Saint
Kitts and Nevis |
1.5 |
| 158 |
 Thailand Thailand |
1.5 |
| 159 |
 United
States United
States |
1.5 |
| 160 |
 Tonga Tonga |
1.4 |
| 161 |
 Egypt Egypt |
1.2 |
| 162 |
 Ireland Ireland |
1.1 |
| 163 |
 Slovenia Slovenia |
1.1 |
| 164 |
 Trinidad
and Tobago Trinidad
and Tobago |
1.1 |
| 165 |
 United
Kingdom United
Kingdom |
1.1 |
| 166 |
 Madagascar Madagascar |
1 |
| 167 |
 Tuvalu Tuvalu |
1 |
| 168 |
 Dominica Dominica |
0.9 |
| 169 |
 Croatia Croatia |
0.8 |
| 170 |
 San
Marino San
Marino |
0.8 |
| 171 |
 Spain Spain |
0.7 |
| 172 |
 Italy Italy |
0.6 |
| 173 |
 Azerbaijan Azerbaijan |
0.2 |
| 174 |
 Cyprus Cyprus |
0 |
| 175 |
 Tunisia Tunisia |
0 |
| 176 |
 Sudan Sudan |
-0.2 |
| 177 |
 Saint
Vincent and the Grenadines Saint
Vincent and the Grenadines |
-0.4 |
| 178 |
 Japan Japan |
-0.5 |
| 179 |
 Andorra Andorra |
-1.8 |
| 180 |
 Syria Syria |
-2 |
| 181 |
 Swaziland Swaziland |
-2.1 |
| 182 |
 Portugal Portugal |
-2.2 |
| 183 |
 Yemen Yemen |
-2.5 |
| 184 |
 Cote
d'Ivoire Cote
d'Ivoire |
-5.8 |
| 185 |
 Greece Greece |
-6 |
Three
fastest growing in each region
Central Asia
| Country |
% Growth |
Date of information |
World Rank |
Region Rank |
 Turkmenistan Turkmenistan |
9.9% |
2012 |
4 |
1 |
 Uzbekistan Uzbekistan |
7.1% |
2012 |
20 |
2 |
 Kyrgyzstan Kyrgyzstan |
7% |
2012 |
21 |
3 |
East Asia
| Country or Reigon |
% Growth |
Date of information |
World Rank |
Region Rank |
 Mongolia Mongolia |
|
|
1 |
 China,
People's Republic of China,
People's Republic of |
9.5% |
2012 |
6 |
2 |
 Hong
Kong, China Hong
Kong, China |
6% |
2012 |
43 |
3 |
South Asia
| Country |
% Growth |
Date of information |
World Rank |
Region Rank |
 Sri
Lanka Sri
Lanka |
8.3% |
2012 |
8 |
1 |
 Bhutan Bhutan |
8.1% |
2012 |
11 |
2 |
 India India |
7.8% |
2012 |
1 |
3 |
Southeast Asia
| Country |
% Growth |
Date of information |
World Rank |
Region Rank |
 Laos Laos |
8.3% |
2012 |
9 |
1 |
 Timor-Leste Timor-Leste |
7.3% |
2012 |
16 |
2 |
 Cambodia Cambodia |
6.7% |
2012 |
26 |
3 |
West Asia
| Country |
% Growth |
Date of information |
World Rank |
Region Rank |
 Qatar Qatar |
18.7% |
2012 |
1 |
1 |
 Iraq Iraq |
9.6% |
2012 |
5 |
2 |
 Turkey Turkey |
8.5% |
2012 |
8 |
3 |
North America
| Country |
% Growth |
Date of information |
World Rank |
Continent Rank |
 Panama Panama |
7.4% |
2012 |
15 |
1 |
 Haiti Haiti |
6.1% |
2012 |
41 |
2 |
 Dominican
Republic Dominican
Republic |
4.5% |
2012 |
84 |
3 |
South America
| Country |
% Growth |
Date of information |
World Rank |
Continent Rank |
 Argentina Argentina |
8.8% |
2012 |
12 |
1 |
 Chile Chile |
6.5% |
2012 |
29 |
2 |
 Paraguay Paraguay |
6.4% |
2012 |
36 |
3 |
Central Africa
| Country |
% Growth |
Date of information |
World Rank |
Region Rank |
 Equatorial
Guinea Equatorial
Guinea |
7.1% |
2012 |
19 |
1 |
 Congo,
Democratic Republic of Congo,
Democratic Republic of |
6.5% |
2012 |
30 |
2 |
 Gabon Gabon |
5.6% |
2012 |
53 |
3 |
East Africa
| Country |
% Growth |
Date of information |
World Rank |
Region Rank |
 Eritrea Eritrea |
8.2% |
2012 |
10 |
1 |
 Ethiopia Ethiopia |
7.5% |
2012 |
14 |
2 |
 Rwanda Rwanda |
7% |
2012 |
23 |
3 |
North Africa
| Country |
% Growth |
Date of information |
World Rank |
Region Rank |
 Morocco Morocco |
4.6% |
2012 |
83 |
1 |
 Algeria Algeria |
2.9% |
2012 |
114 |
2 |
 Egypt Egypt |
1.2% |
2012 |
161 |
3 |
Southern Africa
| Country |
% Growth |
Date of information |
World Rank |
Region Rank |
 Mozambique Mozambique |
7.2% |
2012 |
17 |
1 |
 Zambia Zambia |
6.7% |
2012 |
27 |
2 |
 Botswana Botswana |
6.2% |
2012 |
39 |
3 |
West Africa
| Country |
% Growth |
Date of information |
World Rank |
Region Rank |
 Ghana Ghana |
13.5% |
2012 |
2 |
1 |
 Liberia Liberia |
6.9% |
2012 |
24 |
2 |
 Nigeria Nigeria |
6.9% |
2012 |
25 |
3 |
Central Europe
| Country |
% Growth |
Date of information |
World Rank |
Continent Rank |
 Kosovo Kosovo |
5.3 % |
2012 |
60 |
1 |
 Poland Poland |
3.8% |
2012 |
100 |
2 |
 Austria Austria |
3.3% |
2012 |
109 |
3 |
Eastern Europe
| Country |
% Growth |
Date of information |
World Rank |
Continent Rank |
 Moldova Moldova |
7% |
2012 |
22 |
1 |
 Estonia Estonia |
6.5% |
2012 |
31 |
2 |
 Lithuania Lithuania |
6% |
2012 |
44 |
3 |
Western Europe
| Country |
% Growth |
Date of information |
World Rank |
Continent Rank |
 Sweden Sweden |
4.4% |
2012 |
86 |
1 |
 Luxembourg Luxembourg |
3.6% |
2012 |
104 |
2 |
 Iceland Iceland |
2.4% |
2012 |
127 |
3 |
Oceania
| Country |
% Growth |
Date of information |
World Rank |
Continent Rank |
 Papua
New Guinea Papua
New Guinea |
9% |
2012 |
7 |
1 |
 Solomon
Islands Solomon
Islands |
5.7% |
2012 |
51 |
2 |
 Vanuatu Vanuatu |
3.8% |
2012 |
103 |
3 |
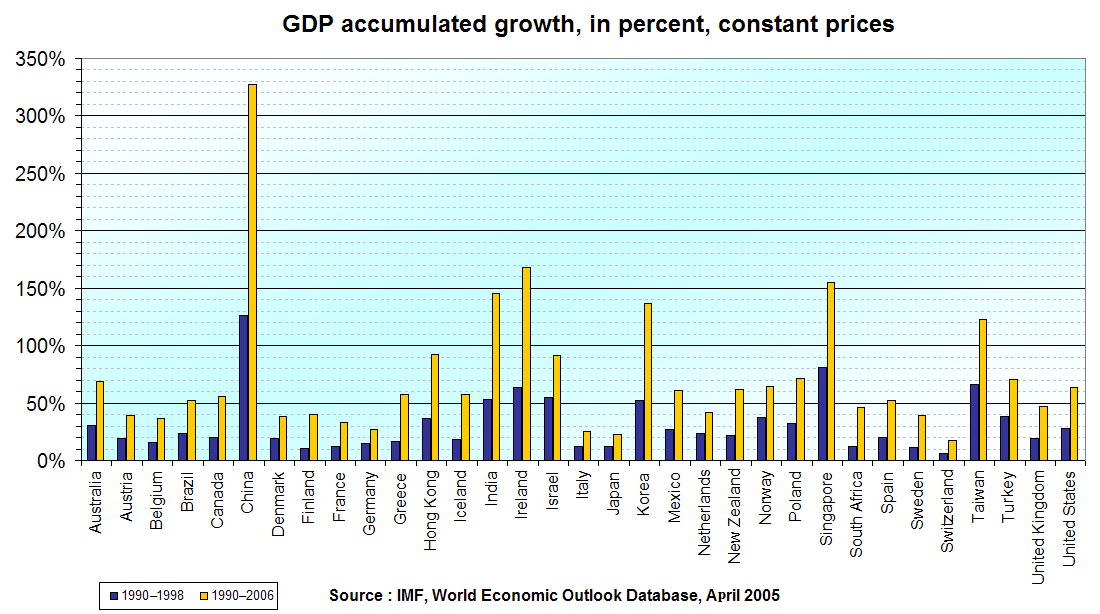
Long range data
For the comparison of economies long range data is more useful
than one-year rates.
GDP real growth rates, 1990-1998 and 1990-2006,
in selected countries
(click to enlarge)
|